pacman::p_load(igraph, tidygraph, ggraph,
               visNetwork, lubridate, clock,
tidyverse, graphlayouts)In-class_Ex08
Loading packages and data
Code chunk:
GAStech_nodes <- read_csv("data/GAStech_email_node.csv")Rows: 54 Columns: 4
── Column specification ────────────────────────────────────────────────────────
Delimiter: ","
chr (3): label, Department, Title
dbl (1): id
ℹ Use `spec()` to retrieve the full column specification for this data.
ℹ Specify the column types or set `show_col_types = FALSE` to quiet this message.GAStech_edges <- read_csv("data/GAStech_email_edge-v2.csv")Rows: 9063 Columns: 8
── Column specification ────────────────────────────────────────────────────────
Delimiter: ","
chr (5): SentDate, Subject, MainSubject, sourceLabel, targetLabel
dbl (2): source, target
time (1): SentTime
ℹ Use `spec()` to retrieve the full column specification for this data.
ℹ Specify the column types or set `show_col_types = FALSE` to quiet this message.Data Wrangling
GAStech_edges <- GAStech_edges %>%
  mutate(SendDate = dmy(SentDate)) %>%
  mutate(Weekday = wday(SentDate,
                        label = TRUE,
                        abbr = FALSE))
GAStech_edges_aggregated <- GAStech_edges %>%
filter(MainSubject == "Work related") %>%
group_by(source, target, Weekday) %>%
summarise(Weight = n()) %>%
filter(source!=target) %>%
filter(Weight > 1) %>%
ungroup()`summarise()` has grouped output by 'source', 'target'. You can override using
the `.groups` argument.Create network objects
GAStech_graph <- tbl_graph(nodes = GAStech_nodes,
                           edges = GAStech_edges_aggregated,
                           directed = TRUE)
GAStech_graph %>%
activate(edges) %>%
arrange(desc(Weight))# A tbl_graph: 54 nodes and 1372 edges
#
# A directed multigraph with 1 component
#
# Edge Data: 1,372 × 4 (active)
from to Weekday Weight
<int> <int> <ord> <int>
1 40 41 Saturday 13
2 41 43 Monday 11
3 35 31 Tuesday 10
4 40 41 Monday 10
5 40 43 Monday 10
6 36 32 Sunday 9
# … with 1,366 more rows
#
# Node Data: 54 × 4
id label Department Title
<dbl> <chr> <chr> <chr>
1 1 Mat.Bramar Administration Assistant to CEO
2 2 Anda.Ribera Administration Assistant to CFO
3 3 Rachel.Pantanal Administration Assistant to CIO
# … with 51 more rowsggraph(GAStech_graph) +
geom_edge_link() +
geom_node_point()Using "stress" as default layoutWarning: Using the `size` aesthetic in this geom was deprecated in ggplot2 3.4.0.
ℹ Please use `linewidth` in the `default_aes` field and elsewhere instead.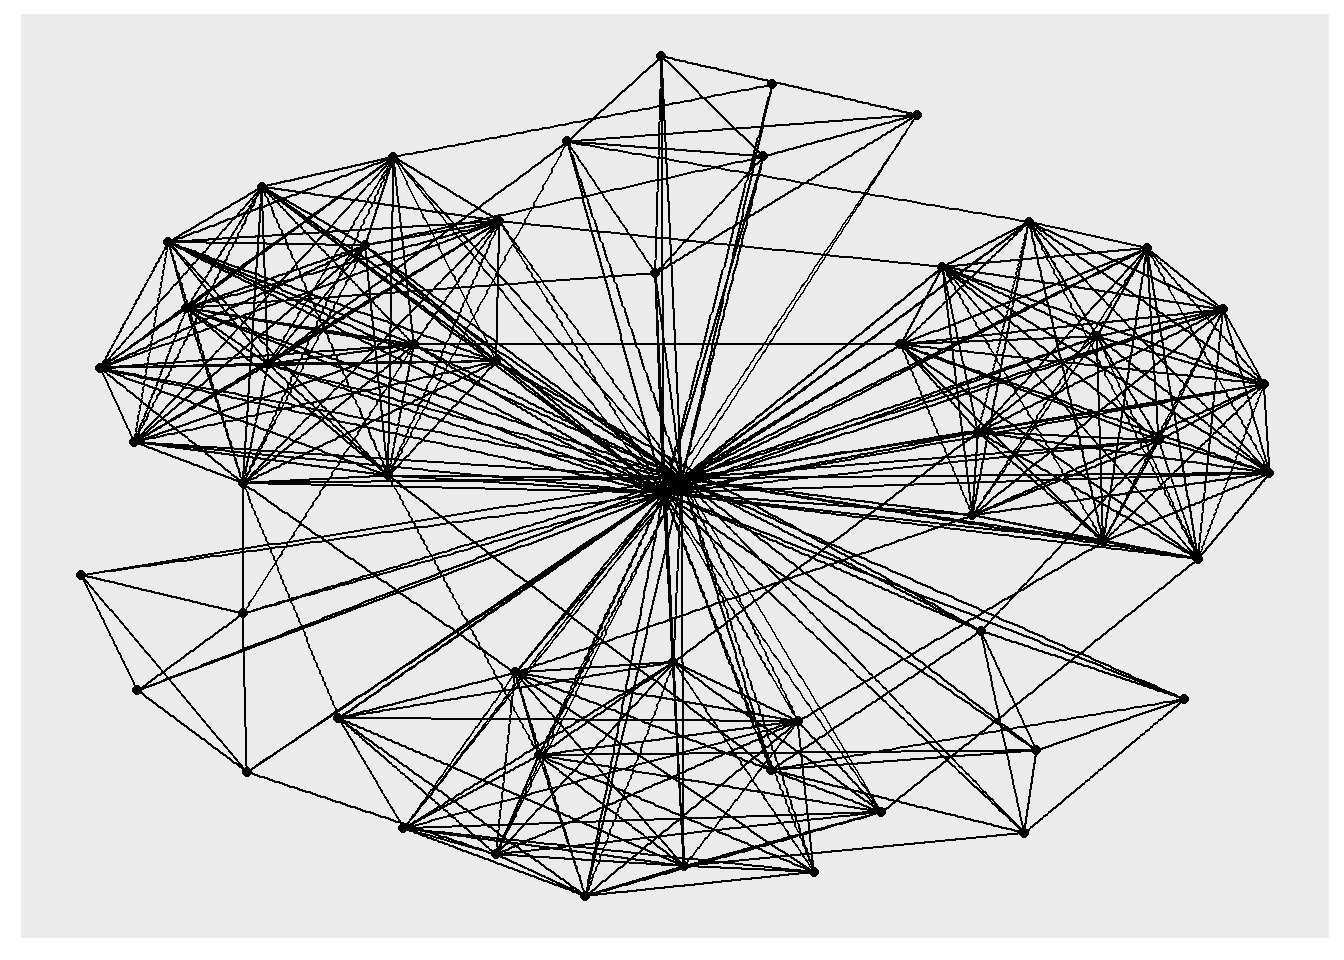
g <- ggraph(GAStech_graph,
            layout = "fr") +
  geom_edge_link(aes()) +
  geom_node_point(aes())

g + theme_graph()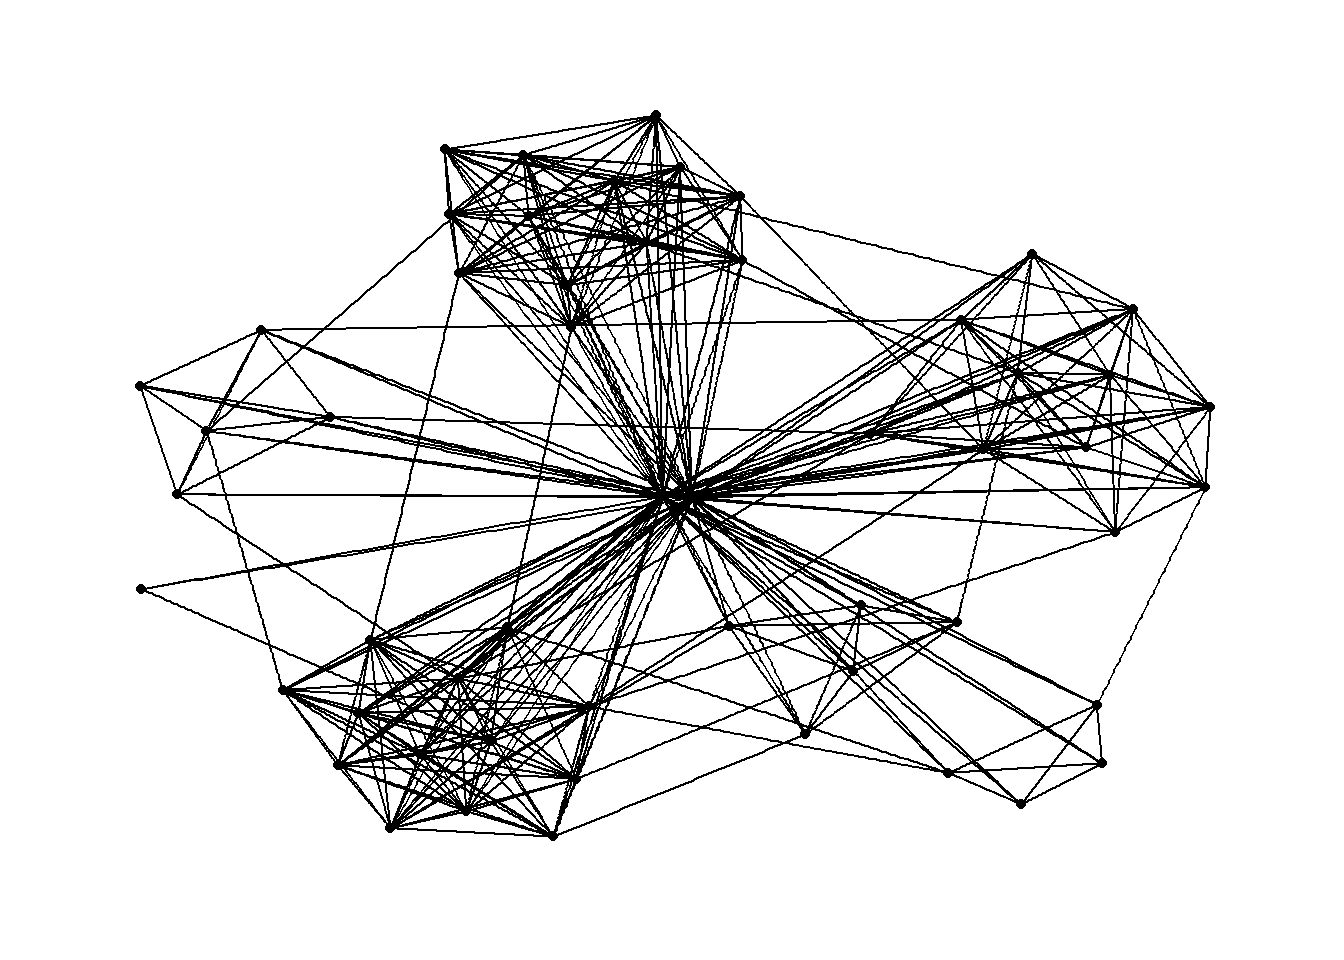
g <- ggraph(GAStech_graph,
            layout = "nicely") +
  geom_edge_link(aes()) +
  geom_node_point(aes(colour = Department,
                      size = 3))

g + theme_graph()
Warning in grid.Call(C_stringMetric, as.graphicsAnnot(x$label)): font family not
found in Windows font database
Warning in grid.Call(C_stringMetric, as.graphicsAnnot(x$label)): font family not
found in Windows font databaseWarning in grid.Call(C_textBounds, as.graphicsAnnot(x$label), x$x, x$y, : font
family not found in Windows font database
Warning in grid.Call(C_textBounds, as.graphicsAnnot(x$label), x$x, x$y, : font
family not found in Windows font database
Warning in grid.Call(C_textBounds, as.graphicsAnnot(x$label), x$x, x$y, : font
family not found in Windows font database
Warning in grid.Call(C_textBounds, as.graphicsAnnot(x$label), x$x, x$y, : font
family not found in Windows font database
Warning in grid.Call(C_textBounds, as.graphicsAnnot(x$label), x$x, x$y, : font
family not found in Windows font database
Warning in grid.Call(C_textBounds, as.graphicsAnnot(x$label), x$x, x$y, : font
family not found in Windows font database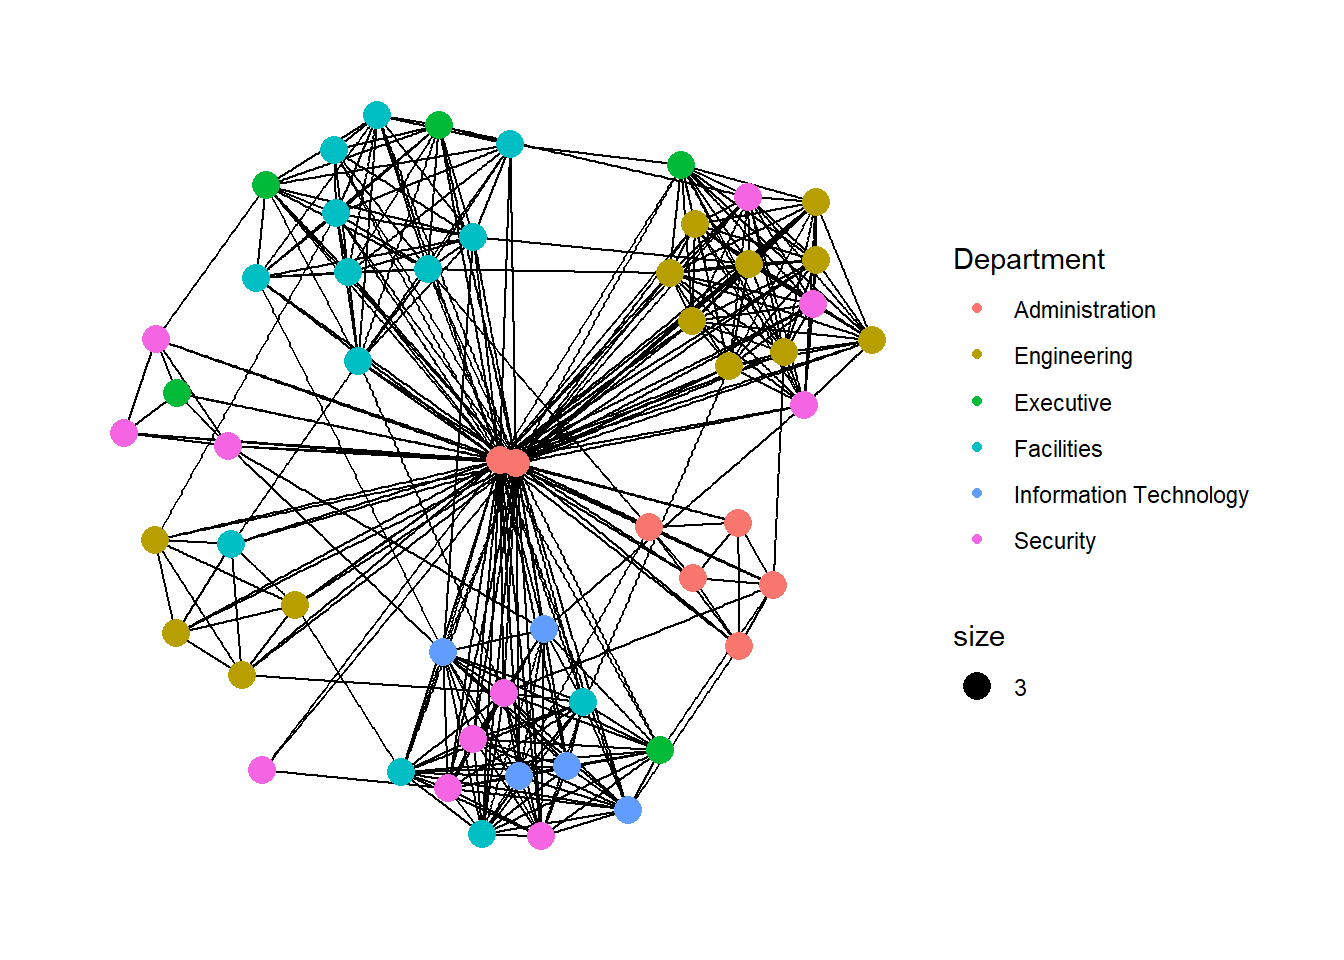
Facet weekdays
set_graph_style()
g <- ggraph(GAStech_graph,
layout = "nicely") +
geom_edge_link(aes(width=Weight),
alpha=0.2) +
scale_edge_width(range = c(0.1, 5)) +
geom_node_point(aes(colour = Department),
size = 2)
g + facet_edges(~Weekday)Warning in grid.Call(C_stringMetric, as.graphicsAnnot(x$label)): font family not
found in Windows font databaseWarning in grid.Call(C_textBounds, as.graphicsAnnot(x$label), x$x, x$y, : font
family not found in Windows font database
Warning in grid.Call(C_textBounds, as.graphicsAnnot(x$label), x$x, x$y, : font
family not found in Windows font database
Warning in grid.Call(C_textBounds, as.graphicsAnnot(x$label), x$x, x$y, : font
family not found in Windows font database
Warning in grid.Call(C_textBounds, as.graphicsAnnot(x$label), x$x, x$y, : font
family not found in Windows font database
Warning in grid.Call(C_textBounds, as.graphicsAnnot(x$label), x$x, x$y, : font
family not found in Windows font databaseWarning in grid.Call.graphics(C_text, as.graphicsAnnot(x$label), x$x, x$y, :
font family not found in Windows font databaseWarning in grid.Call(C_textBounds, as.graphicsAnnot(x$label), x$x, x$y, : font
family not found in Windows font database
Warning in grid.Call(C_textBounds, as.graphicsAnnot(x$label), x$x, x$y, : font
family not found in Windows font database
Warning in grid.Call(C_textBounds, as.graphicsAnnot(x$label), x$x, x$y, : font
family not found in Windows font database
Warning in grid.Call(C_textBounds, as.graphicsAnnot(x$label), x$x, x$y, : font
family not found in Windows font database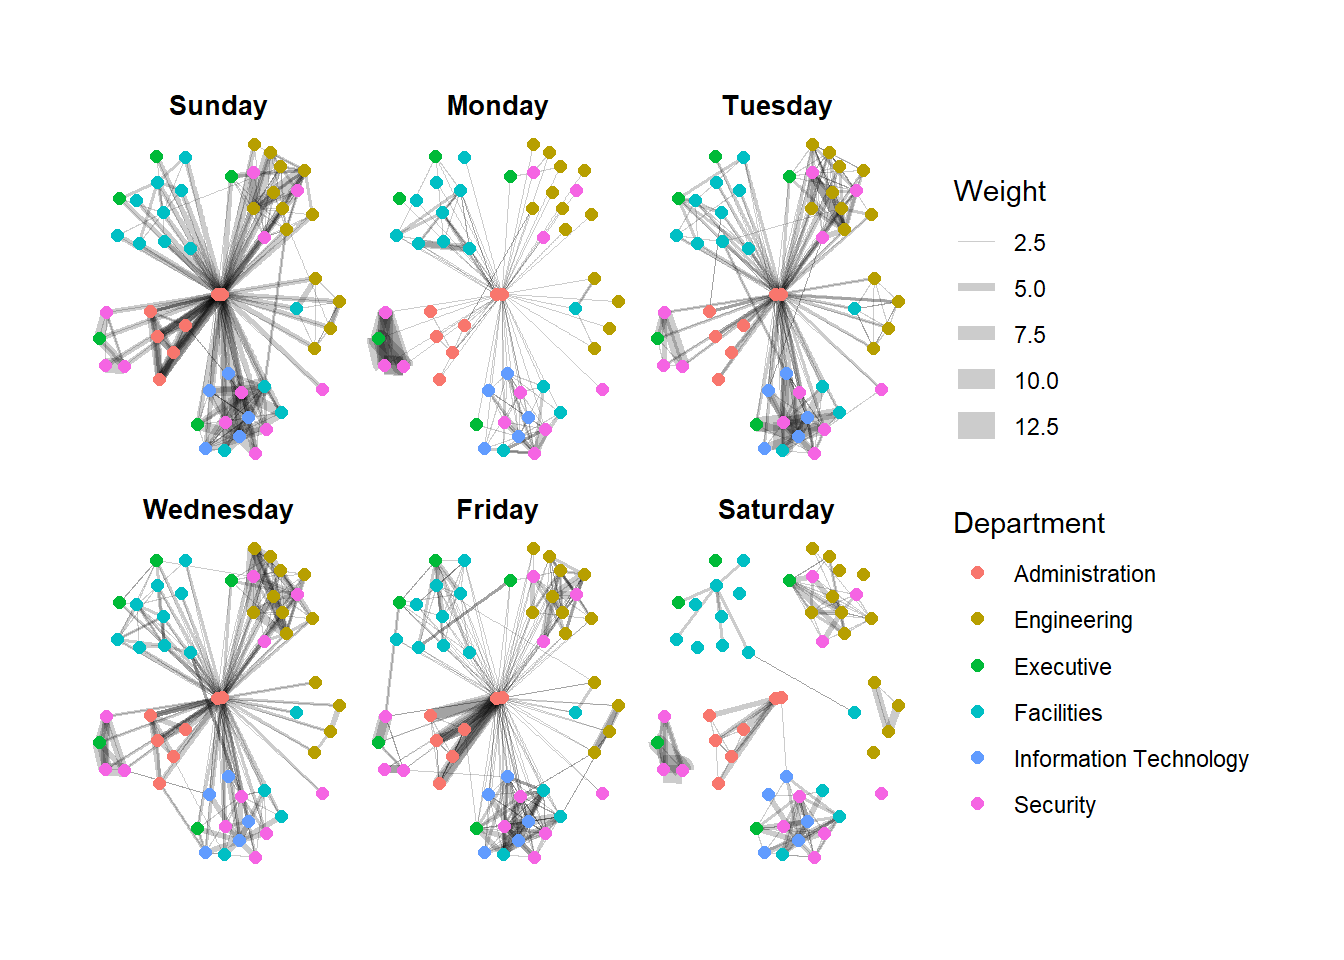
g <- GAStech_graph %>%
mutate(betweenness_centrality = centrality_betweenness()) %>%
ggraph(layout = "fr") +
geom_edge_link(aes(width=Weight),
alpha=0.2) +
scale_edge_width(range = c(0.1, 5)) +
geom_node_point(aes(colour = Department,
size=betweenness_centrality))
g + theme_graph()Warning in grid.Call(C_textBounds, as.graphicsAnnot(x$label), x$x, x$y, : font
family not found in Windows font database
Warning in grid.Call(C_textBounds, as.graphicsAnnot(x$label), x$x, x$y, : font
family not found in Windows font database

Warning in grid.Call(C_textBounds, as.graphicsAnnot(x$label), x$x, x$y, : font
family not found in Windows font database

Warning in grid.Call(C_textBounds, as.graphicsAnnot(x$label), x$x, x$y, : font
family not found in Windows font database

Warning in grid.Call(C_textBounds, as.graphicsAnnot(x$label), x$x, x$y, : font
family not found in Windows font database

Warning in grid.Call(C_textBounds, as.graphicsAnnot(x$label), x$x, x$y, : font
family not found in Windows font database

Warning in grid.Call(C_textBounds, as.graphicsAnnot(x$label), x$x, x$y, : font
family not found in Windows font database
Warning in grid.Call(C_textBounds, as.graphicsAnnot(x$label), x$x, x$y, : font
family not found in Windows font database

Warning in grid.Call(C_textBounds, as.graphicsAnnot(x$label), x$x, x$y, : font
family not found in Windows font database

Warning in grid.Call(C_textBounds, as.graphicsAnnot(x$label), x$x, x$y, : font
family not found in Windows font database

Warning in grid.Call(C_textBounds, as.graphicsAnnot(x$label), x$x, x$y, : font
family not found in Windows font database

Warning in grid.Call(C_textBounds, as.graphicsAnnot(x$label), x$x, x$y, : font
family not found in Windows font database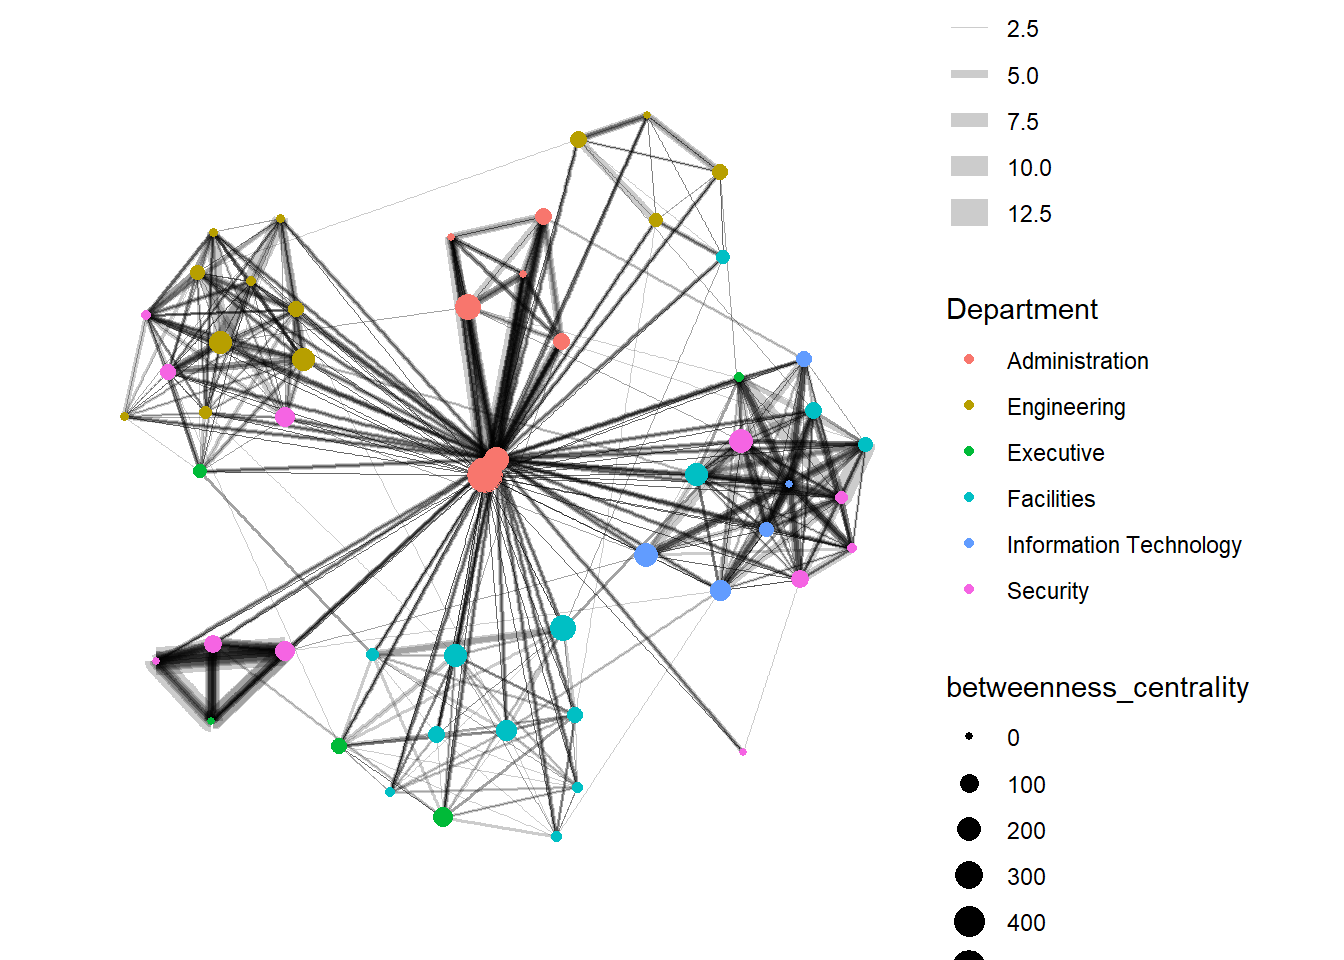
g <- GAStech_graph %>%
ggraph(layout = "fr") +
geom_edge_link(aes(width=Weight),
alpha=0.2) +
scale_edge_width(range = c(0.1, 5)) +
geom_node_point(aes(colour = Department,
size = centrality_betweenness()))
g + theme_graph()Warning in grid.Call(C_textBounds, as.graphicsAnnot(x$label), x$x, x$y, : font
family not found in Windows font database
Warning in grid.Call(C_textBounds, as.graphicsAnnot(x$label), x$x, x$y, : font
family not found in Windows font database

Warning in grid.Call(C_textBounds, as.graphicsAnnot(x$label), x$x, x$y, : font
family not found in Windows font database

Warning in grid.Call(C_textBounds, as.graphicsAnnot(x$label), x$x, x$y, : font
family not found in Windows font database

Warning in grid.Call(C_textBounds, as.graphicsAnnot(x$label), x$x, x$y, : font
family not found in Windows font database
Warning in grid.Call(C_textBounds, as.graphicsAnnot(x$label), x$x, x$y, : font
family not found in Windows font database
Warning in grid.Call(C_textBounds, as.graphicsAnnot(x$label), x$x, x$y, : font
family not found in Windows font database
Warning in grid.Call(C_textBounds, as.graphicsAnnot(x$label), x$x, x$y, : font
family not found in Windows font database
Warning in grid.Call(C_textBounds, as.graphicsAnnot(x$label), x$x, x$y, : font
family not found in Windows font database
Warning in grid.Call(C_textBounds, as.graphicsAnnot(x$label), x$x, x$y, : font
family not found in Windows font database
Warning in grid.Call(C_textBounds, as.graphicsAnnot(x$label), x$x, x$y, : font
family not found in Windows font database
Warning in grid.Call(C_textBounds, as.graphicsAnnot(x$label), x$x, x$y, : font
family not found in Windows font database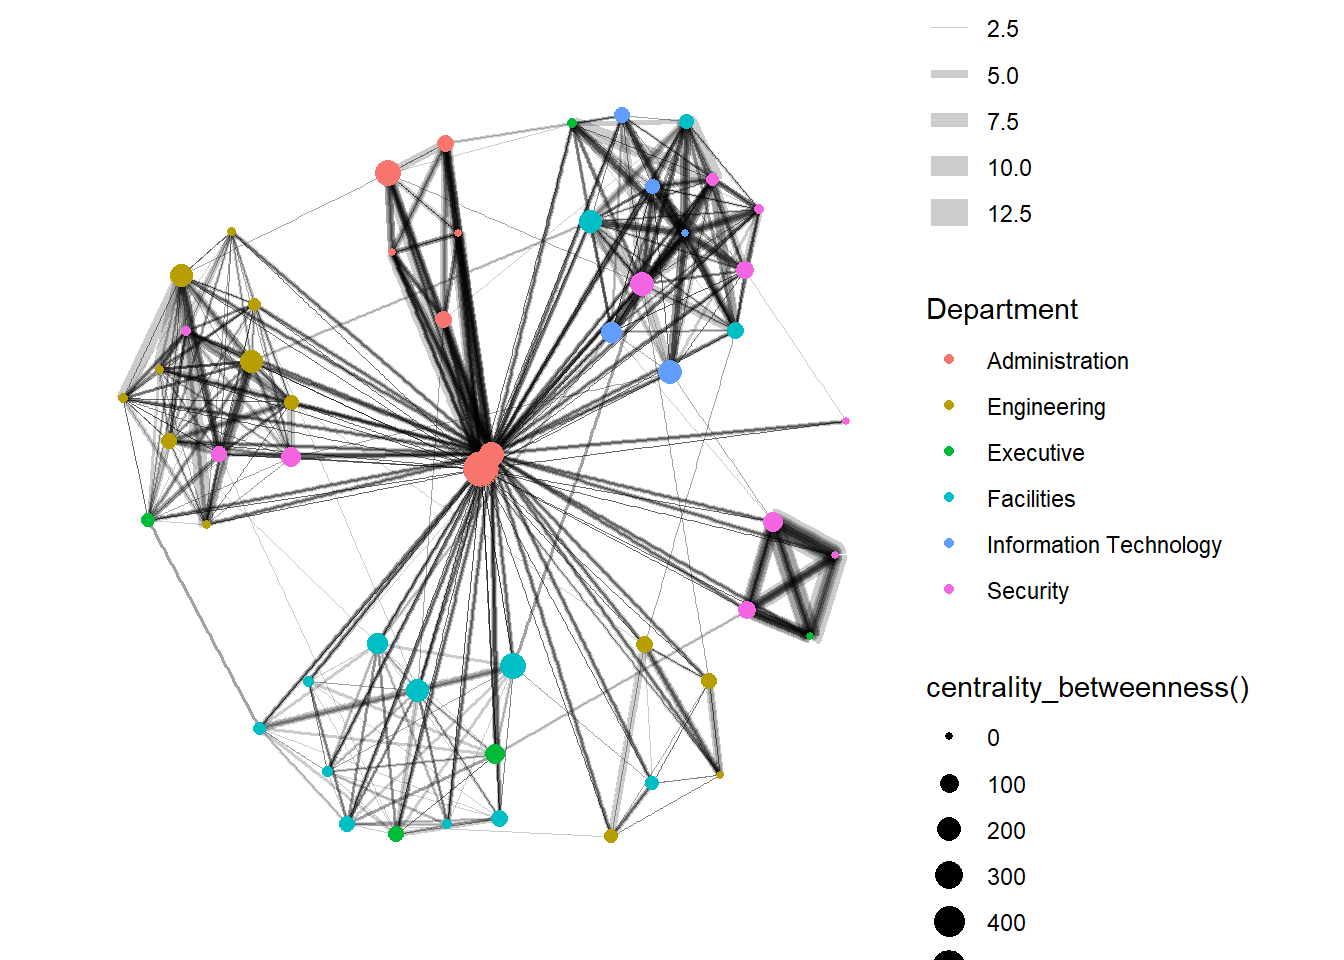
g <- GAStech_graph %>%
  mutate(community = as.factor(group_edge_betweenness(weights = Weight, directed = TRUE))) %>%
  ggraph(layout = "fr") +
  geom_edge_link(aes(width=Weight),
                 alpha=0.2) +
  scale_edge_width(range = c(0.1, 5)) +
  geom_node_point(aes(colour = community))
Warning in cluster_edge_betweenness(graph = .G(), weights = weights, directed =
directed): At core/community/edge_betweenness.c:492 : Membership vector will be
selected based on the highest modularity score.Warning in cluster_edge_betweenness(graph = .G(), weights = weights, directed
= directed): At core/community/edge_betweenness.c:497 : Modularity calculation
with weighted edge betweenness community detection might not make sense --
modularity treats edge weights as similarities while edge betwenness treats them
as distances.g + theme_graph()Warning in grid.Call(C_textBounds, as.graphicsAnnot(x$label), x$x, x$y, : font
family not found in Windows font databaseWarning in grid.Call(C_textBounds, as.graphicsAnnot(x$label), x$x, x$y, : font
family not found in Windows font database
Warning in grid.Call(C_textBounds, as.graphicsAnnot(x$label), x$x, x$y, : font
family not found in Windows font database
Warning in grid.Call(C_textBounds, as.graphicsAnnot(x$label), x$x, x$y, : font
family not found in Windows font database
Warning in grid.Call(C_textBounds, as.graphicsAnnot(x$label), x$x, x$y, : font
family not found in Windows font database
Warning in grid.Call(C_textBounds, as.graphicsAnnot(x$label), x$x, x$y, : font
family not found in Windows font database
Warning in grid.Call(C_textBounds, as.graphicsAnnot(x$label), x$x, x$y, : font
family not found in Windows font database
Warning in grid.Call(C_textBounds, as.graphicsAnnot(x$label), x$x, x$y, : font
family not found in Windows font database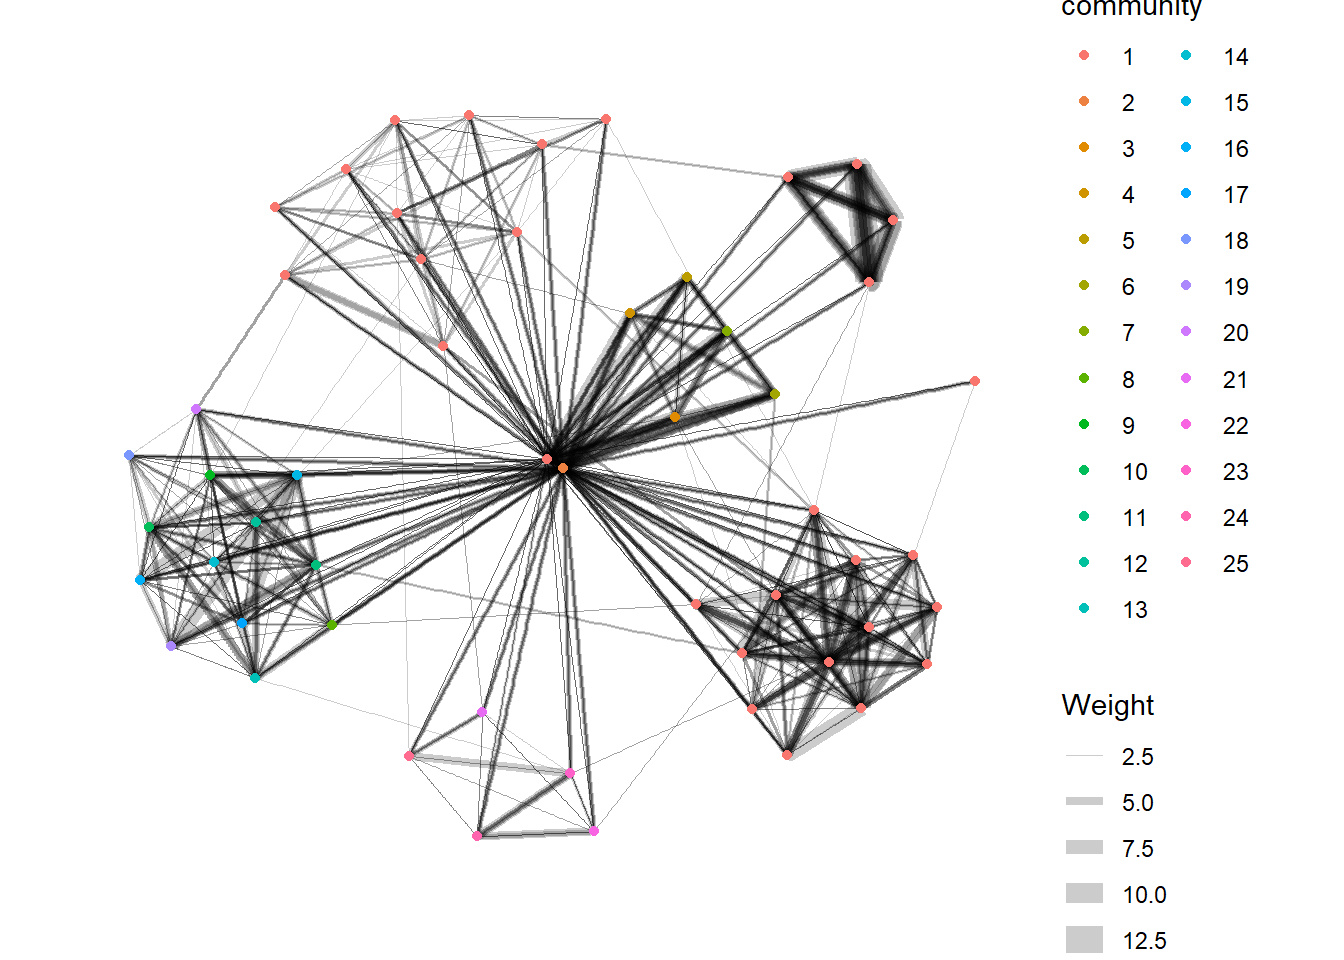
Interactive Network graph
GAStech_edges_aggregated <- GAStech_edges %>%
  left_join(GAStech_nodes, by = c("sourceLabel" = "label")) %>%
  rename(from = id) %>%
  left_join(GAStech_nodes, by = c("targetLabel" = "label")) %>%
  rename(to = id) %>%
  filter(MainSubject == "Work related") %>%
  group_by(from, to) %>%
    summarise(weight = n()) %>%
  filter(from!=to) %>%
  filter(weight > 1) %>%
  ungroup()
`summarise()` has grouped output by 'from'. You can override using the
`.groups` argument.visNetwork(GAStech_nodes,
GAStech_edges_aggregated)visNetwork(GAStech_nodes,
GAStech_edges_aggregated) %>%
visIgraphLayout(layout = "layout_with_fr") visNetwork(GAStech_nodes,
GAStech_edges_aggregated) %>%
visIgraphLayout(layout = "layout_with_fr") %>%
visLegend() %>%
visLayout(randomSeed = 123)visNetwork(GAStech_nodes,
GAStech_edges_aggregated) %>%
visIgraphLayout(layout = "layout_with_fr") %>%
visEdges(arrows = "to",
smooth = list(enabled = TRUE,
type = "curvedCW")) %>%
visLegend() %>%
visLayout(randomSeed = 123)